A KPI information collection app that tracks and presents key performance metrics.
The app we created allows to collect information about operational objectives - along with easy-to-use tools to visualize that data in the dashboard.
The app we created allows to collect information about operational objectives - along with easy-to-use tools to visualize that data in the dashboard.
In highly competitive industries, Business Intelligence has a huge impact on sales performance. What drives sales, how well are products promoted and what is performing best affects the structure and decisions of the entire enterprise. Measurement and systematic assessment of key indicators (KPIs) is key. With the information gathered, you can implement strategies, recovery plans, or build brand-wide marketing objectives.
The problem is the dispersion of information and the need to complete, transform and present it manually. All of these activities are time-consuming and repetitive, and they can be automated. They are vulnerable to errors and omissions that are hard to detect. Monthly reporting requires not only data acquisition, but also verification and transformation into easy to understand summaries and visualizations.
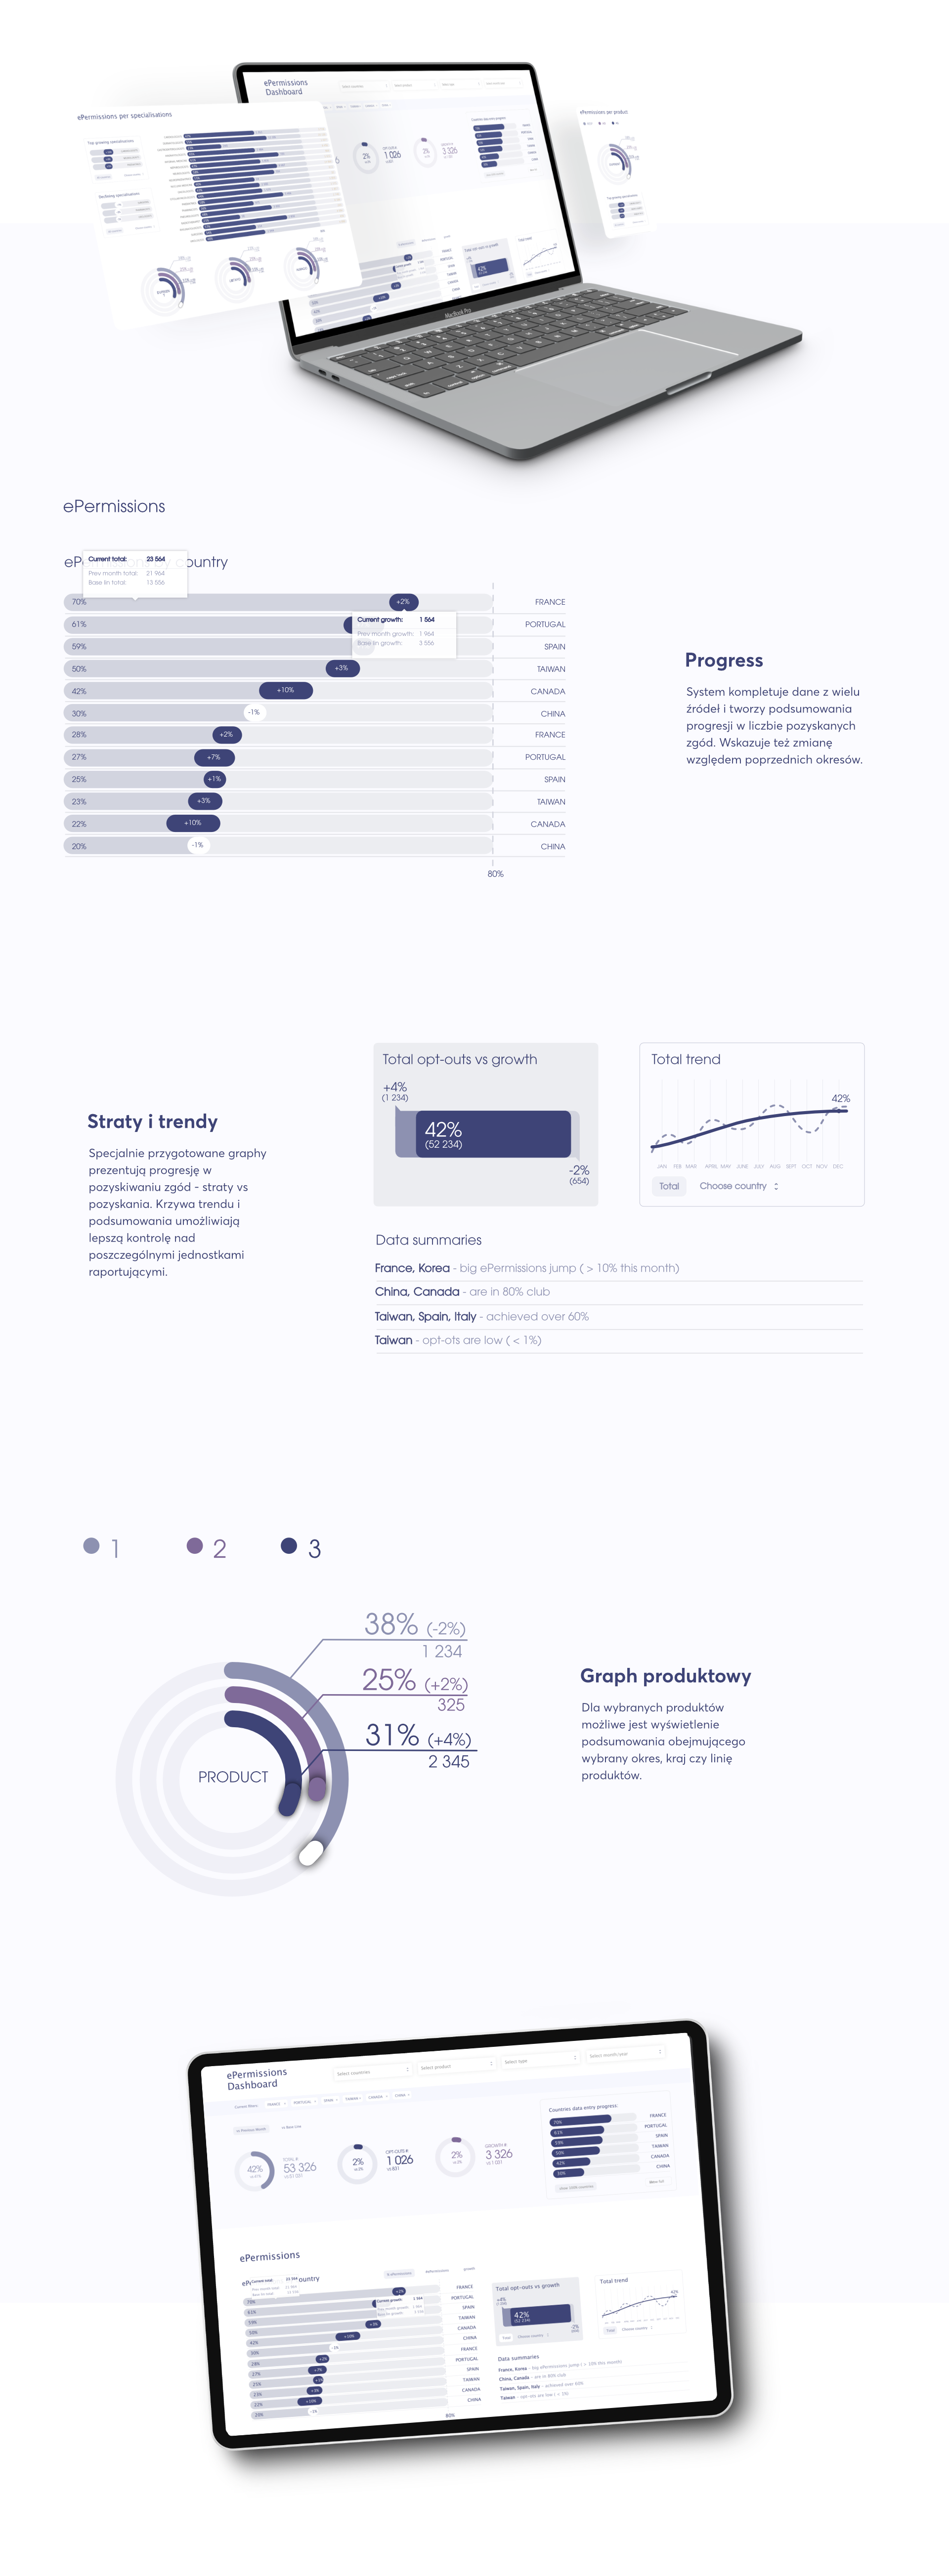
We designed and developed a system where users can import scattered data in one place, and all summaries, reports and presentations are generated automatically allowing for fast business intelligence overview. This means that users can easily add the data they have and all of the summaries, indicators are calculated and presented in fully automated process. For that we have also designed a data visualization graphs and charts that allow to create comparisons and discover trends.
Additionally the app automatically creates summary reports in PDF format, allows to export data, create rankings and even send requests to specific users. Thanks to the understanding of the data structure and appropriate data base structuring, the system has no limitations, the data can be presented and analyzed in the form that is required and most effective at a given moment providing business intelligence that is most important at the time it is required.
The time needed to generate summaries and rankings as interactive graphs or PDF report
indicators affecting the results in particular rankings and summaries
the number of countries using the app for their rankings and summaries
When we created a Business Intelligence application for a global top 10 pharmaceutical company, we had to focus on clearly presenting the data and presenting the relevant data to the appropriate audience. To do this, we had to understand the structure of the company, understand the product range in depth and optimize the processes that had thus far been created mainly in time-consuming Excel sheets.